
Average Project Cost
See where budgets land across 500+ builds — including the $48,500 average and +8% YoY shift — so planning starts from real spend, not guesses.

Annual Industry Report — V2026
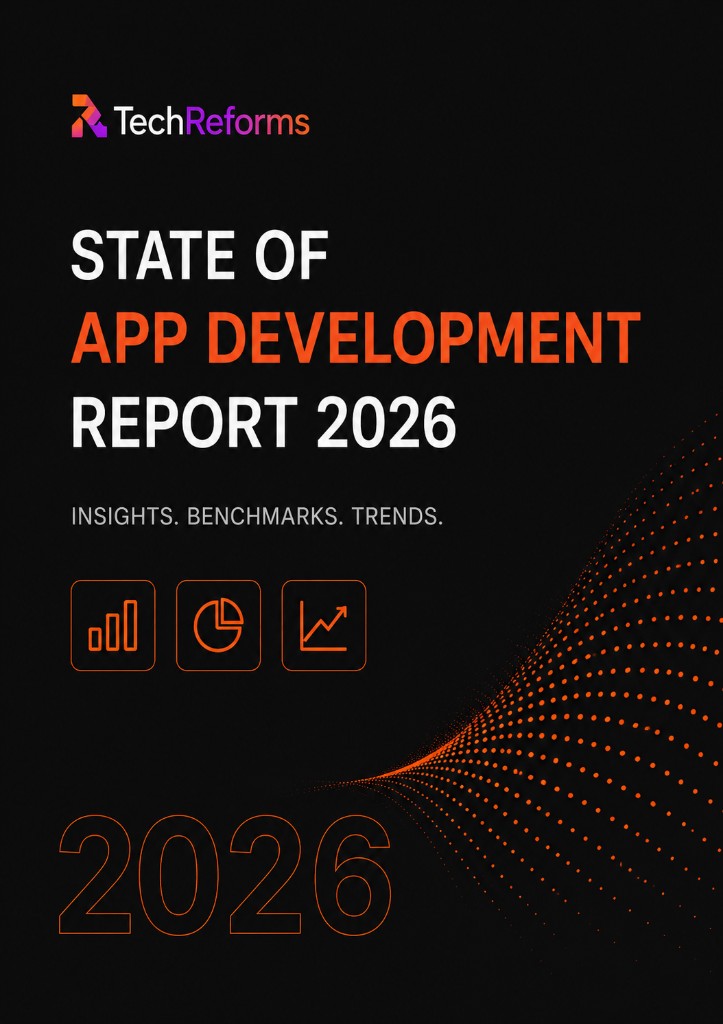
Cost benchmarks, development timelines, technology trends, hiring insights, and real-world pricing data collected from hundreds of successful software projects.
Everything decision-makers need before starting a software project.
See where budgets land across 500+ builds — including the $48,500 average and +8% YoY shift — so planning starts from real spend, not guesses.
Benchmark average delivery at 14.2 weeks and the −6% YoY improvement so you set realistic milestones from discovery through launch.
Track how 67% of projects now use AI in development — up 22pp YoY — and what that means for tooling, quality, and team velocity.
Compare cross-platform share at 54 / 38, with Flutter ahead by 6pp, to choose a stack before rework becomes expensive.
Learn why AI personalization leads demand — cited in 43% of projects — and which capabilities buyers ask for first.
Measure loyalty signals at 61% repeat/referral rate (+4pp YoY) to understand what keeps partners coming back after launch.
Headline figures across all 500+ projects in the dataset. Year-over-year deltas compare against the 2025 report cohort.
Average project cost
$48,500
Average delivery timeline
14.2 wks
Projects using AI in dev workflow
67%
Flutter vs React Native
54 / 38
Most requested feature
AI personalization
Repeat / referral clients
61%
Median cost by project complexity tier, based on fixed-bid and time-and-materials engagements combined.
| Tier | Typical Scope | Cost Range (USD) | Median |
|---|---|---|---|
| Simple / MVP | Single platform, 3–5 core screens, no backend complexity | $8K – $22K | $14,500 |
| Mid-complexity | Cross-platform, API integrations, auth, payments | $25K – $65K | $41,000 |
| Enterprise-grade | Multi-platform, custom backend, compliance, scale requirements | $70K – $220K+ | $118,000 |
Median delivery time from kickoff to production release, by complexity tier.
Qualitative shifts observed across the 2025 project cohort.
Platform
78% of new projects began as cross-platform builds rather than native-first, up from 64% in 2024, driven by budget pressure and shrinking timelines.
Budget
Initial-build budgets shrank as a share of total spend, while ongoing iteration and feature-add retainers grew — a sign clients are treating apps as products, not one-off deliverables.
Teams
82% of projects were delivered by fully or majority-remote teams, with no measurable difference in on-time delivery rate versus co-located teams.
Build
Roughly 1 in 5 Simple/MVP-tier projects now combine no-code backend tooling with custom front-end work to compress cost and timeline.
How AI tooling is being used inside the development process itself — separate from AI features requested by clients.
Using AI code assistants
71%
Using AI in QA / test generation
44%
Reported build-time reduction
~18%
Relative strengths across time-to-market, cost, performance, and hiring — based on patterns from 500+ shipped projects.
| Framework | Time-To-Market | Cost Efficiency | Performance | Hiring Pool |
|---|---|---|---|---|
Flutter Dart | ||||
React Native JavaScript | ||||
Native (iOS/Android) Swift / Kotlin | ||||
Kotlin Multiplatform Kotlin |
Visual trends across the 2022–2026 report series.
Transparent sourcing, sample scope, and known limits — so every benchmark can be read in context.
This report aggregates anonymized delivery data from TechReforms' internal project records for engagements completed between January 2024 and December 2025, supplemented by a survey of client stakeholders.
Projects span fintech, healthtech, retail, logistics, and SaaS, across startups to mid-market and enterprise teams, in 14 countries.
Cost and timeline figures reflect this dataset's client mix and may not generalize to markets or project types outside it. Figures are reported as medians unless stated otherwise, to reduce the influence of outlier enterprise engagements.
Dataset snapshot
Core numbers behind every chart and benchmark on this page.
All benchmarks, charts, and the complete methodology in one document — including breakdowns not published on this page.
Tell us where to send it — we'll share the complete State of App Development Report 2026.